HT1 - Load, visualize, crop and export a T-Lidar point cloud
 ...version française de cette page ...version française de cette page |
Objective
This tutorial shows how to:
- Load a .xyb point cloud : sample_cloud.xyb (located in the HowTo folder)
- Display the point cloud in the step manager, the model manager and in a 3D view
- Extract a circular or rectangular plot
- Export data as file
Load a ploint cloud
This platform operates in steps that are displayed in the StepManager window. To open a file, you must add a new step. Use the  button and select the .xyb file.

To actually begin charging the file, press the  button.
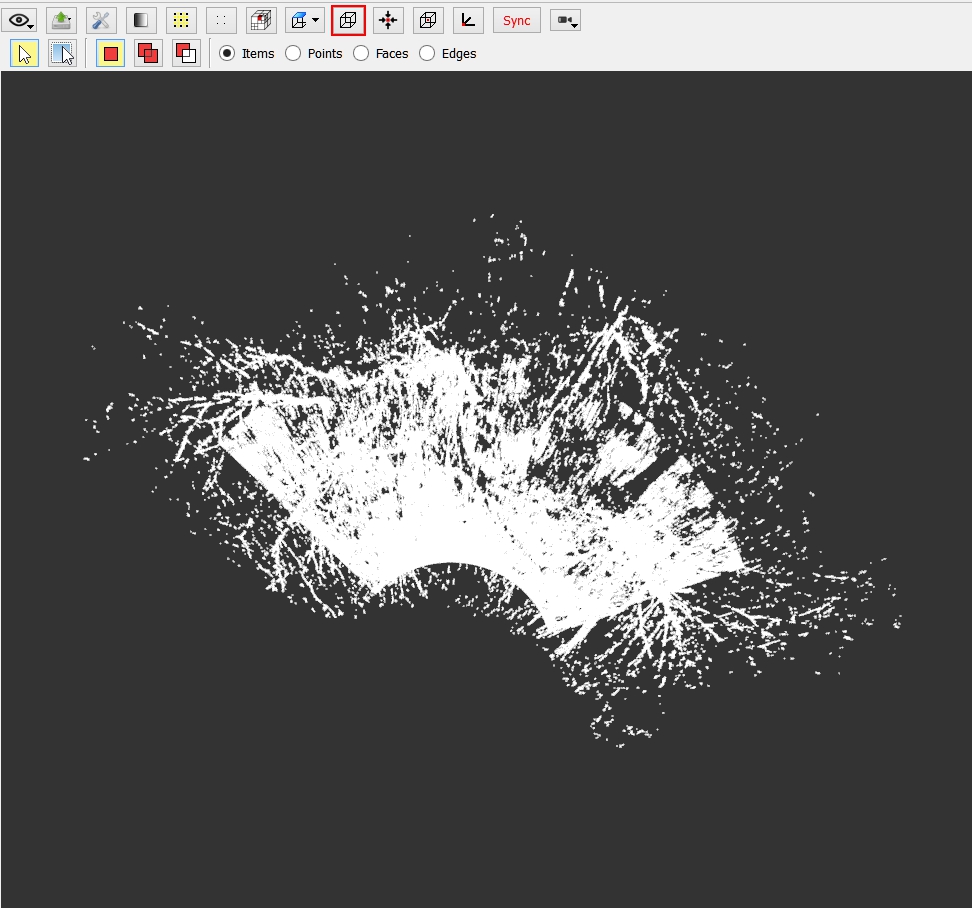
When a step execution is completed, the progressing bar is full and the result can be diplayed by activating the Result checkbox in the Step manager window :

You may notice that subresults are created as well in the Model manager :
- a Scene which contains the actual point cloud
- ??? Intensity
- ??? Scanner
Display the point cloud
To view a particular element, activate the corresponding checkbox in the Model manager window. To display scan points in the 3D view, check the Scene box.
N.B. : Use the  button to ajust camera view to visible elements.
In the 3D view, you can manually adjust view using the left click button (rotation), the right click button (translation) and the scroll wheel (zoom).
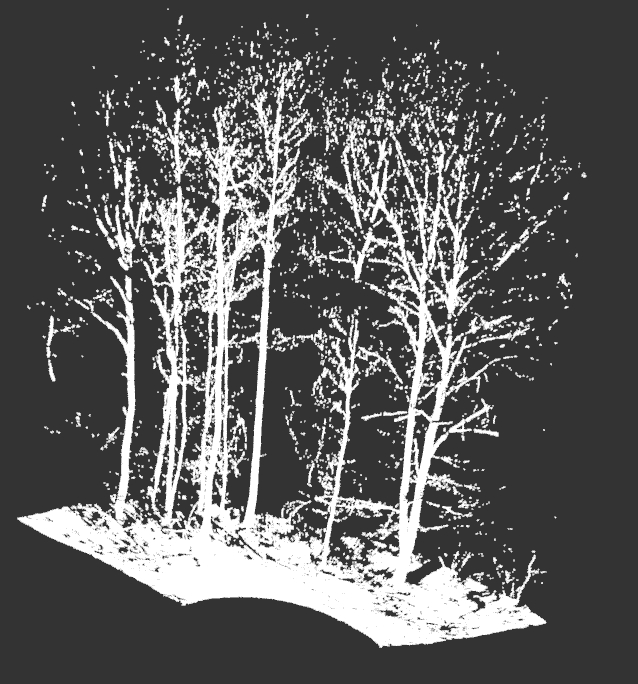
Exemple for another perspective :
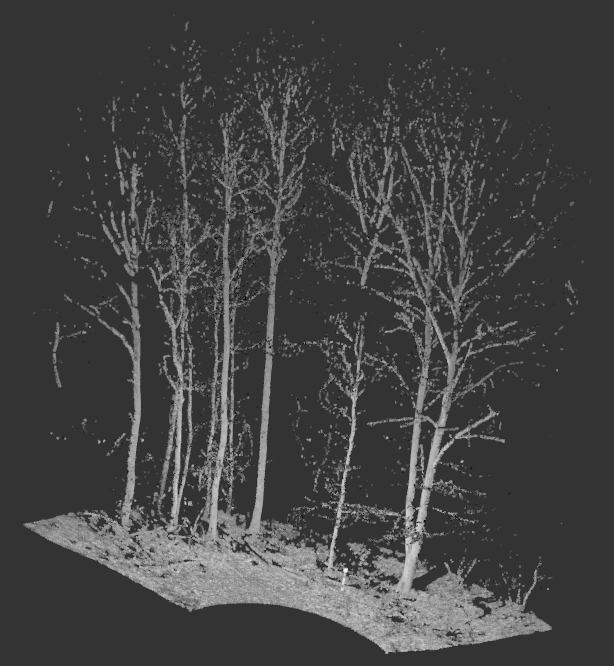
The points intensity can also be displayed. In order to do that, use the  button that gives access to the Configure colors window :
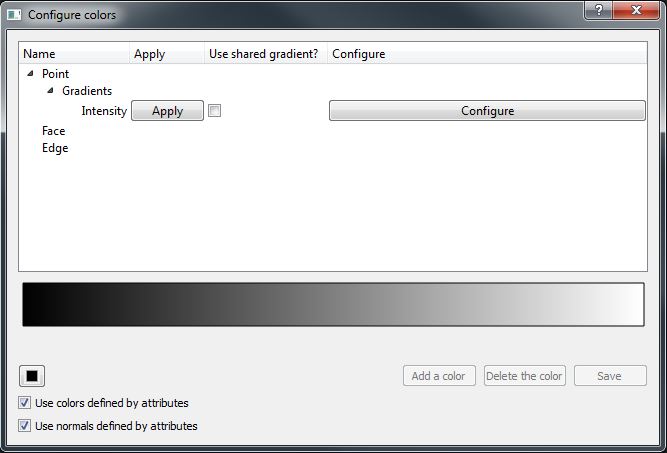
Click on the Apply button to display intensity :
Plot extraction
There are different possibilities in order to extract a portion of the point cloud.
The HT1_Load_Crop_Export_Cloud.xsct2 script uses two of these methods :
- The OE_StepExtractPlot step, found in the ONF - ENSAM plugin is used to extract a circular plot of a given radius (onfensamv2 / Extraction of plot )
- The TK_StepExtractBox step, found in the ToolKit plugin is used to extract a portion of the point cloud using a bounding box (toolkit / Exctract Sub-Cloud / Extraction of a point cloud // bounding box )
The OE_StepExtractPlot tool takes as parameters :
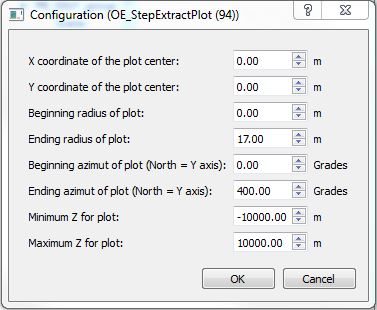
- The X and Y coordinates of the plot center
- A Maximum plot radius
- The Z minimum and maximum values
- If a Plot start radius is given, the plot will be annular (ring-shaped)
- If you wish to extract a sector, a Start and End azimuth can also be defined.
The TK_StepExtractBox tool takes as parameters :
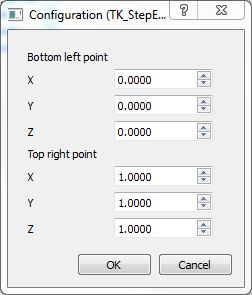
- The bottom left coordinates (X,Y,Z) of the bounding box
- The top right coordinates (X,Y,Z) of the bounding box
Save point cloud to file
The  button enables you to export a point cloud to a specified format.

| Back to How Tos list |