 ...version française de cette page
 | ...version française de cette page |
This tutorial shows how to :
Please refer to tutorial HT1 - Load, visualize, crop and export a T-Lidar point cloud at the Load a ploint cloud section.
Please refer to tutorial HT1 - Load, visualize, crop and export a T-Lidar point cloud at the Plot extraction section.
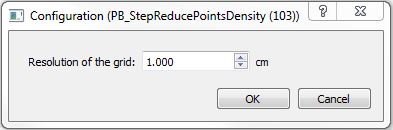
The PB_stepReducePointsDensity step is found in the base plugin (base / Points clouds / Points density reduction).
If you are using multiple scans, it is recommended to add a step for point density reduction to decrease calculation time. Depending on your computer performances, a 0.5 or 1 cm Grid resolution should be fine.
Please refer to tutorial HT2 - Create a Digital Terrain Model from a T-Lidar point cloud.
The OE_StepHorizontalClustering04 step is found in the onfensamv2 plugin (onfensamv2 / Clustering by horizontal slices)

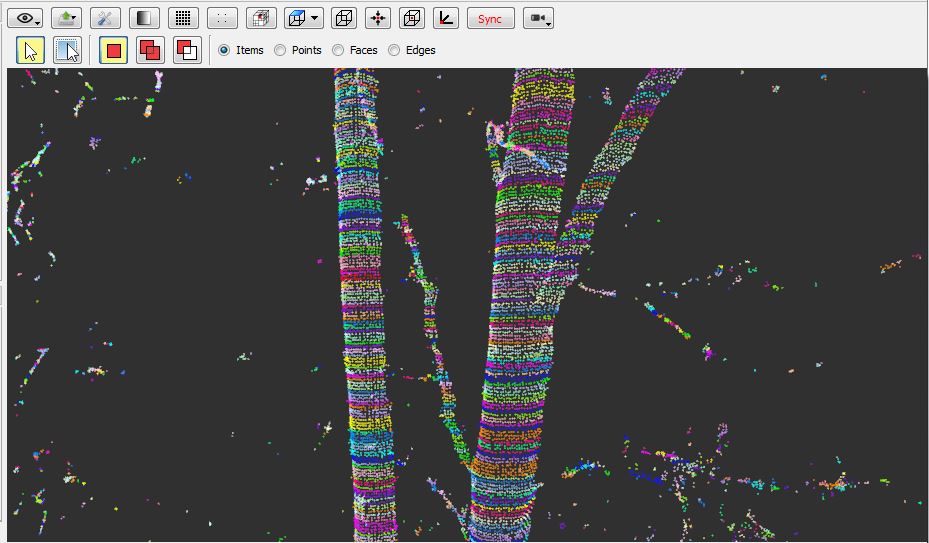
This step creates horixontal clusters. The scene is divided in horizontal layers of a specified Thickness. Then, for each layer, points are gathered in clusters according to the distance between them. The Maximum distance between two points of the same group must be indicated.

Results of the horizontal clustering:
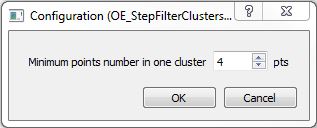
The OE_StepFilterClustersBySize step is found in the onfensamv2 plugin (onfensamv2 / Filtering of clusters by points number)
This step filters undersized clusters. Clusters with a number of points strictly lower than the Minimum points number are eliminated.
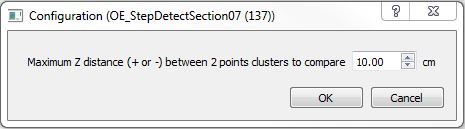
The OE_StepDetectSection07 step is found in the onfensamv2 plugin (onfensamv2 / Vertical merging of clusters in logs)
This step verticaly aggregates clusters in sections (logs). A Vertical distance threshold is indicated to compare clusters in pairs. If both clusters’ bounding boxes intersect on that distance threshold, clusters are merged. A log stops when there is a vertical break in the cluster. Scan occlusions or presence of a branch are commun causes.
Results of the clusters merging in logs:
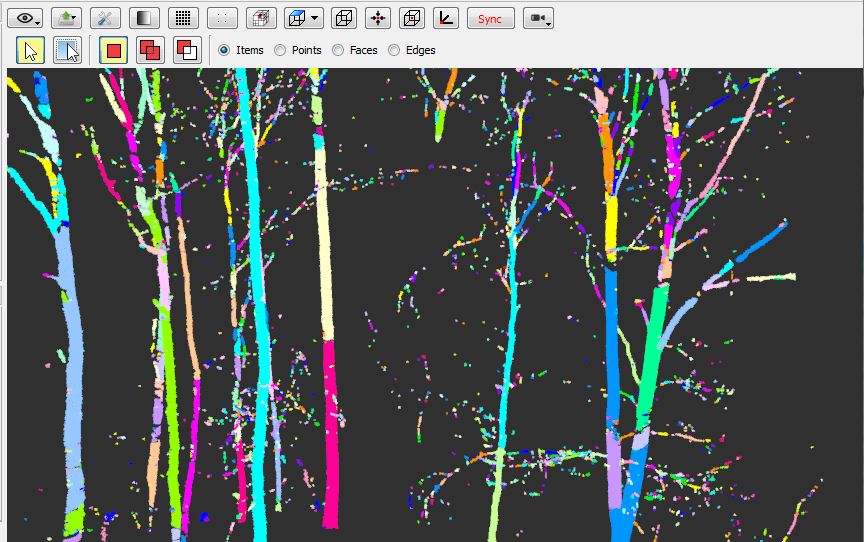
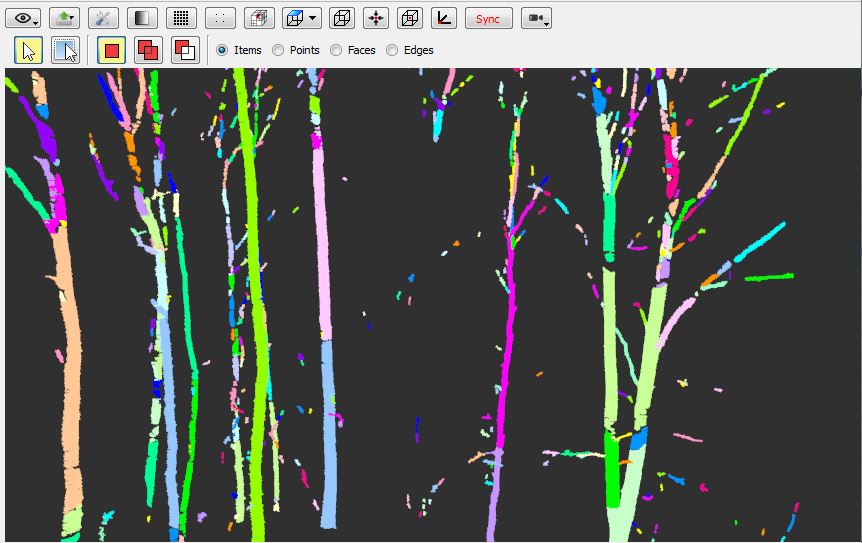
The OE_StepFilterGroupsByGroupsNumber step is found in the onfensamv2 plugin (onfensamv2 / Filtering lvl 1 groups / number of lvl 2 groups)
This generic method removes groups (logs) that have a poor number of subgroups (clusters). Level 1 groups (logs) are eliminated if they got an insufficient Level 2 number of groups (clusters). This step is used to clear most of the small branches and false logs.
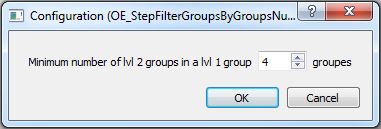
Results of the log filtering:
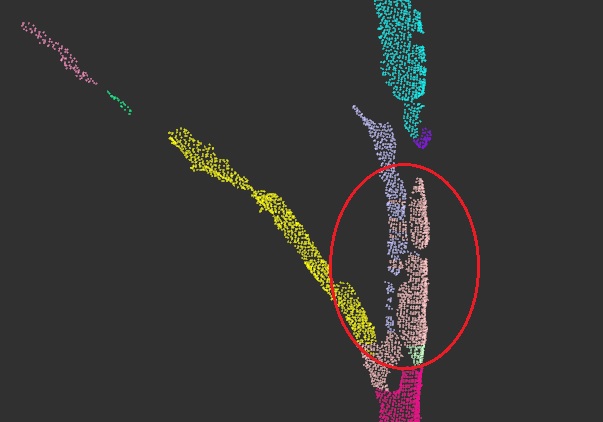
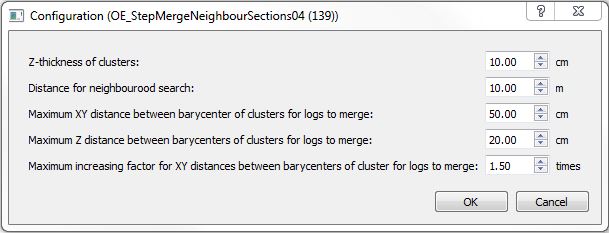
The OE_StepMergeNeighbourSections04 step is found in the onfensamv2 plugin (onfensamv2 / Merging of parallel logs)
This step merges adjacent logs. When there is occlusion in the point cloud, branches can be cut so that two logs are created instead of one:
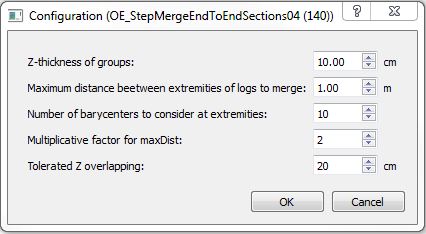
The OE_StepMergeEndToEndSections04 step is found in the onfensamv2 plugin (onfensamv2 / Merging of aligned logs)
This step merges logs that are aligned in direction. The step operates this way (see also the technical diagram below):
Technical diagram:
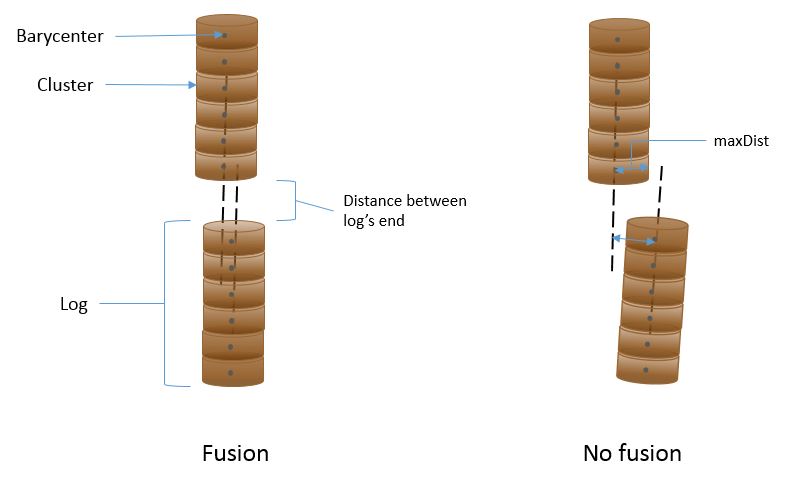
Results of the fusion:

The OE_StepSetFootCoordinatesVertically step is found in the onfensamv2 plugin (onfensamv2 / Addition od a base coordinante by log // DTM)

There are no parameters needed. This step sets coordinates for tree positions by projecting the lowest cluster on the MNT.
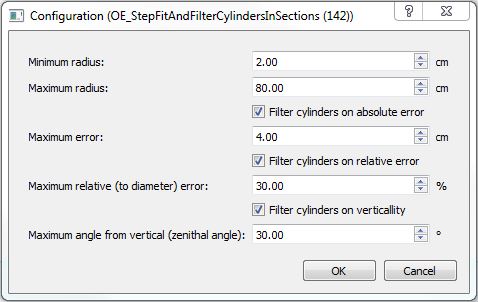
The OE_StepFitAndFilterCylindersInSections step is found in the onfensamv2 plugin (onfensamv2 / Fitting / Filtering of cylinders by log)
This step creates cylinders and filters them depending of their goodness of fit. The tool requires a Minimum radius and Maximum radius so that small or large trees are not represented. Cylinders can be filtered on the Absolute error and/or the Relative error. They also can be filtered on their verticality, a Maximum vertical angle from solar zenith must be specified.
Results of the cylinder fitting:
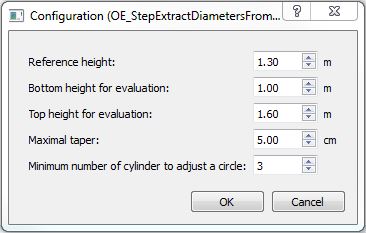
The OE_StepExtractDiametersFromCylinders step is found in the onfensamv2 plugin (onfensamv2 / Computing of cylinders mean diameter by log)
This tool compute trees’ diameter at breast height (DBH). In order to do that, a cercle is adjusted on a previously created cylinder. A Bottom height and a Top height for evaluation are specified. Cercles radii are calculated between these values in order to calculate a regression. The Reference height value (generally 1.30 meters) is interpolated of this regression. The Maximal taper is used to insure that no abberant cylinders are used in the calculation. A Minimum number of cylinders to adjust a circle is also specified.
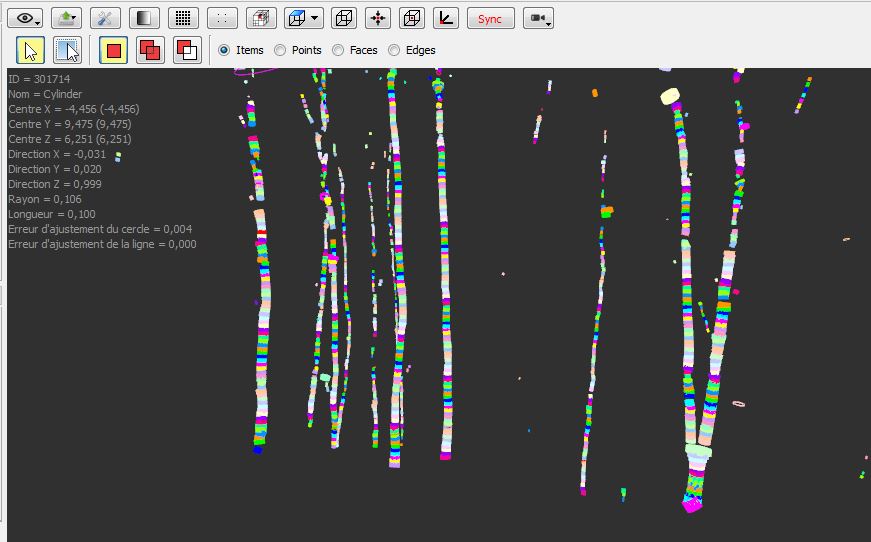
To visualize the adjusted cercles , you must activate the results in the Step and Model managers.
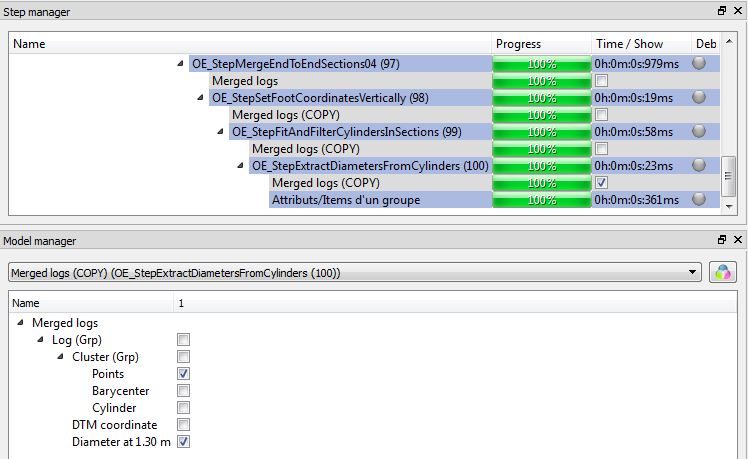
To visualize the results attributes, activate  Information ItemDrawable in the Action tab and then select an object.

The PB_CSVExporter step is found in the base plugin (base / Exporters / Export d’attributs (csv))
First, select the input result.
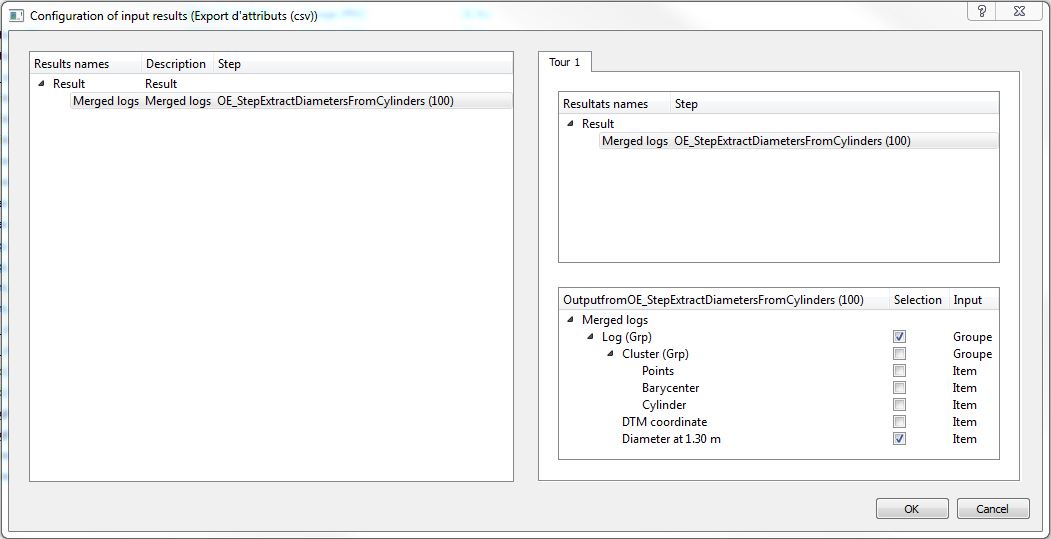
Then, drag and drop attributes you wish to include in the file.
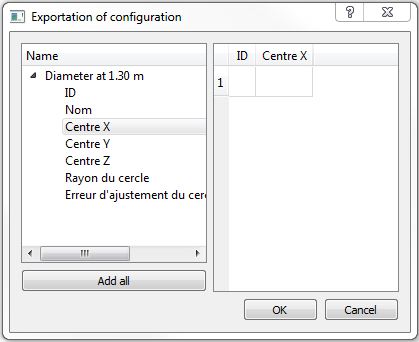
Finally, specify the path and file name.

| Back to How Tos list |